Benchmark reports are increasingly common in the human services sector, but how do you know if this data is valuable to your organization? This blog post provides an overview of benchmarking and tips for evaluating the quality of benchmark data available to you.
What does a bench have to do with it?
Not much – unless you’re a craftsperson in antiquity. The term benchmark comes from the marks made on wooden workbenches to indicate shoe size (for cobblers), the length of board needed (for carpenters), etc. Today, a benchmark is a summary calculation – typically an average or median – which attempts to tell us what is normal for a metric.
Benchmarking within the human services sector usually comes in 3 flavors:
- Outcomes benchmarks are complex measures of change in behavior, thinking, or status. Examples include permanency in child welfare systems (such as these dashboards from the Minnesota Department of Human Services) or abstinence rate/reduction in use measures in substance use disorder treatment services. They speak to the success of a program, service, or intervention.
- Administration and management benchmarks are measures of organizational health and stability and target human resource management, financial management, governance, and similar activities. Related metrics speak to the foundational elements of an organization on which quality service delivery depends, and include staff retention rate, months cash on hand, or average board attendance rate.
- Fundraising/development benchmarks are measures of marketing and development success and efficiency. Examples include the open rate of an email seeking donations or giving rates by demographic categories. These benchmarks are the most commonly available (often at a price) as they are standard in marketing software solutions and easy to calculate and share.
What makes a good benchmark?
A benchmark is composed of 3 basic elements: the metric, the benchmark value, and the comparison group. You will need a strong definition of each to determine the value of a benchmark to your organization and should expect any quality benchmark report to outline them.
The metric
The metric should be clearly defined with a title, description, purpose, time period, and the underlying formula. Let’s use a common Human Resources measure, staff turnover, as an example:
Staff turnover is the rate of employees who leave an organization and are replaced by new employees in the stated fiscal year. This measure demonstrates an organization’s ability to maintain a stable and qualified workforce and is calculated as: (Total number of employees at the start of the fiscal year minus the total number of employees who left) divided by the total number of employees at the start of the fiscal year.
A well-defined metric is a strong indicator that all participating organizations calculated their figure consistently.
The benchmark value
This is the summary calculation and is typically an average, median, or—occasionally —a range of the sample. Here is a description of each:
- The average or mean is the “typical” value in the data. The average is only appropriate for data with a normal distribution (the bell curve shape) and is sensitive to outliers in the data.
- The median is the middle value in the data. It is less susceptible to outliers and appropriate for data with a non-normal distribution. Not sure what a normal or non-normal distribution is? No worries! The average and median will be extremely close if the data has a normal distribution, so—in any case—the median is always a safe bet.
- A full set of descriptive statistics provide a nuanced but complex view of the data’s distribution; it is the most illustrative method of describing benchmark data but can easily overwhelm most readers. These calculations can include: minimum value, maximum value, average, median, standard deviation, quartiles/percentiles, and the interquartile range.
The comparison group
The comparison group is comprised of the organizations participating in the benchmarking project. Understanding the comparison group is more than knowing the number of organizations which submitted data to the project; their overall demographic profile is the best way to assess the benchmark’s value to your organization.
What is the value of a staff turnover benchmark to a substance use treatment organization if the benchmark was generated using data from 100 arts nonprofits? A benchmark is only as valuable as its comparison integrity: the extent to which the comparison group matches the organization utilizing the benchmark to contextualize its performance. And this is what makes quality benchmarking so difficult.
A well-defined comparison group allows you to gauge the relevance of the benchmark to your organization. To have any value, a benchmarking project must collect a variety of demographic data about the participating organizations. Typical variables include:
- Revenue/budget amount: a general measure of organization size; other measures can include workforce size or average clients served per year
- Location: city, state, region, and/or community types such as urban, suburban, and rural
- Services provided: anywhere from general service categories (child welfare, behavioral health, etc.) to specific program models; this is exceptionally difficult because there are few taxonomies (systems of categorization) for human services
Why is a good benchmark so hard to find?
Generating high-quality benchmark data is a complex, time-consuming task, and, for many benchmarking projects, there is no guarantee of success. A benchmarking project requires the following.
The participants
As stressed above, coding the demographic characteristics of participating organizations is paramount. Other demographic variables typically include organization size (determined by revenue or employee count), location (region, state, and/or city), types of clients served (age, needs, or similar), and – principally – the types of services provided by the organization.
Unfortunately, the only ubiquitous, standardized method of coding human services organizations by services provided comes from the National Taxonomy of Exempt Entities (NTEE) code assigned to all tax-exempt organizations by the Internal Revenue Service (IRS); see a complete list here. However, because this code is determined solely by the IRS, it may not accurately reflect the organization’s actual services.
Well-defined, desirable metrics
The entity leading the benchmarking project must identify commonly-accepted metrics for which participating organizations see a valuable ROI. There must be clear definitions and calculation steps for each metric (yes, the dreaded data dictionary), and participating organizations must agree on their value.
Two-way reporting system
Participating organizations must have a way to provide their data and receive a benchmark report in return. Ideally, this benchmark report is dynamic and displays the data submitted by the organization side-by-side with the benchmark figure.
Quality assurance system
The system to collect and store data must have quality assurance checks to both prevent bad data from entering and identify bad data if it circumvents initial safeguards.
Longitudinal data
The best benchmarking projects will repeat their procedure on a regular schedule and collect data from the same group of participating organizations, or a fluid group of participating organizations with similar demographic characteristics.
Why utilize benchmark data?
There are 4 great reasons to seek out external benchmark data relevant to your organization.
1. Share your success with clients, grant-makers, regulators, and your Board of Trustees
These folks love data, and you love contextualizing your performance. Enriching your reports with external benchmark data can further highlight your successes, pad seemingly-poor performance (“Our turnover rate has risen but is still well under industry benchmarks”), and demonstrate your love of data and participation in the human services world beyond your walls.
2. Feed your performance and quality improvement system
A rich, enmeshed performance and quality improvement (PQI) system is the cornerstone of the Council on Accreditation’s standards and process. From the PQI standard itself:
COA’s Performance and Quality Improvement (PQI) standards provide the framework for implementation of a sustainable, organization-wide PQI system that increases the organization’s capacity to make data-informed decisions that support achievement of performance targets, program goals, positive client outcomes, and staff and client satisfaction. Building and sustaining a comprehensive, mission-driven PQI system is dependent upon the active engagement of staff from all departments of the organization, persons served, and other stakeholders throughout the improvement cycle.
Your organization is likely benchmarking performance already – that is, anytime you look to past performance to evaluate current performance. But finding benchmarks derived from peer organizations further contextualizes performance and pulls your organization out of the limited, sometimes-myopic world of its own data.
3. Get folks talking!
If you use dashboards, you’re probably seeing the same data every day. The line rises; the line falls. The number goes red; the number goes green. Over time, familiarity with the trends in your data can be desensitizing. You understand what is normal and what is not – but all of this happens within the insular universe of your organization.
External benchmark data – and particularly longitudinal benchmark data – gives more context to performance and can reinvigorate data-informed conversations which have faded over time.
4. Set goals and acknowledge high performance
Your performance and quality improvement system craves goals as a driver of performance. External benchmark data can be a powerful tool for pushing staff/programs, but this data can also further celebrate staff/programs performing above the benchmark.
What has been your experience with benchmark data?
Tell us your favorite sources of benchmark data or how you’ve integrated it into your organization’s operations in the comments below!
A big thank you to Tristan Keelan of TenEleven Group for this guest post!
The Behavioral Health field is undergoing a data revolution where electronic capture of daily activity is expected to produce reports that demonstrate, among other things, quality. The initial response to this paradigm shift is to have an electronic health record that can capture data, and produce reporting and analytics capabilities that use the data to demonstrate agency effectiveness. While front-end data capture and back-end information reporting are certainly critical elements of the value based care equation, there is still an element of intervention required by your Quality and Compliance staff to ensure that your data has integrity. To achieve data integrity, you need to make sure that you’re collecting your data in a repeatable manner that provides consistent and accurate data.
Find your outcomes measurement tool
One of the best ways to demonstrate value in behavioral health is to adopt standardized outcomes measurement tools. Tools like the CANS/ANSA, PHQ-9, DLA-20, GAD-7, Columbia Suicide Risk Scale, and many others are designed to allow for the measurement of client populations to be viewed in aggregate for the purposes of demonstrating agency effectiveness. However, the integrity of the outcomes data you capture is going to be critical for framing the story telling that is done once your results are in.
3 tips for maintaining outcomes integrity
The three critical elements that you can manipulate to drive data integrity within your outcomes tools all revolve around creating and enforcing repeatable processes. When your processes are repeatable, you can present your reports with foundational context that improves your presentation. This can turn “here are our numbers,” into “We follow these processes and procedures, which we know drive success, and the proof is here in our numbers.” And the second version is much more convincing.
These three elements are:
1. Determine the cadence that outcomes measures will be captured by, and enforce it.
You want to use standardized outcomes measurement tools so that you can find a way to commonly measure success across your patient population as the progress through treatment over time. Normally when we measure patient outcomes over time, we would make the date the tool was administered the X-axis that would drive our visual; however, in the case of behavioral health outcomes measurement at the agency level we cannot do that.
If you were to look at outcomes scores by date, you end up with a mash up of scattered data because clients are not all seen on the same days. For a visual example, look to the PHQ-9 outcomes scores shown in the graph below:

To rectify this and bring your clients into an “apples to apples” view of progress, you must group the scores into the iteration of the form that was administered – first time, second time, third time, etc. When you do that, you bring a focus to what your outcomes look like at the agency level.
The image below shows the same data set, for the same time period, but it is organized with “Administration Number,” as the X-axis to bring the average improvements of client across the agency into focus.

To make this data tell the story you want, you must be able to articulate what your process for capturing the outcomes measurement is. For example, the measure could be administered every time the customer is seen. Or, every 3rd visit. Or, every 3 months (maybe this coincides with treatment plan reviews). Whatever your agency’s choice is, it should be agreed upon, and enforced. From a quality enforcement standpoint, there should be monitoring reports and procedures to follow-up with therapists who have clients fall out of the agency defined outcomes measurement procedures.
Those monitoring reports can also be run historically to determine how often your process is falling outside the desired timeframes, and thus how far off your data integrity is from the desired. If your monitoring reports show that your clinicians are administering the PHQ-9 at different points in treatment for each client, you will have a low data integrity.
Your agency should strive to be able to speak to outcomes in terms of the example phrase, “the positive trend in PHQ-9 scores reflects our process to administer the measurement tool within 14 days of the treatment planning due date, which we achieve 99% of the time.”
When your Behavioral Health agency can add these types of process statements in conjunction with positive trending outcomes reports, then your value proposition appears substantially stronger to your audience.
2. Acknowledge outcome drift – respect the anchors and keep them front and center
Your clinical staff wants their clients to improve; that’s why they got into this business in the first place. However, this presents a common problem for clinical staff who administer scoring tools. Because the desire is for the client to improve, the previous score can often replace the scoring anchors in the subconscious of the person doing the scoring.
For example, consider the following simplistic version of a hypothetical 3 point symptomatic scale.
In the past month, how often did you experience feelings of anxiety?
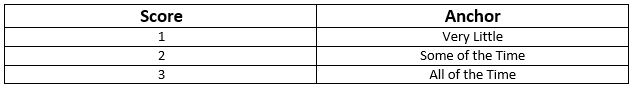
In our example, let’s assume the client has scored a 2 on the past two administrations of the tool. The therapist can begin to rationalize that while the client is exhibiting signs that reflect a 2 = Some of the Time, they seem to be doing better overall. Instead of marking a 2 for the third time in a row on this question, the therapist can begin to use the desire for improvement to justify marking a 1 = Very Little because of the appearance of overall improvement.
This type of “Anchor Drift” is natural and should not prevent the use of standardized outcomes tools, but rather should be protected against. There can be a tendency in EHR software systems to streamline forms in a way that removes unnecessary elements that may have existed in the original paper version. This is where it helps to combat that tendency to drift toward improvement by making the anchors present on the form every time it is completed.
In this case if our anchors, “Very Little,” “Some of the Time,” and “All of the Time” are right next to the questions, it will help to subconsciously override the client’s previous score as the anchor. Stripping out the anchors on an electronic form seems like an efficiency gain of space on the screen, but a smart EHR will keep outcomes anchors present on the form to hold the integrity of the tool above the well-meaning desire for clients to improve.
3. Periodically audit your outcome tool with self-assessments
In conjunction with the previous effort to maintain integrity to the outcomes anchors, you can enforce an audit of your clinical staff compared against your client population. Introduce the client to the outcomes anchors, and ask them and the therapist to each complete separate versions of the form at the same point in the treatment. Then you can measure the variance between them at the agency, therapist, and client levels.
As with all things discussed thus far, there are multiple ways to conduct this audit, and it’s really all about establishing and maintaining process. You can dictate that a self-assessment audit is performed every fourth administration of the outcomes tool. Or, call for random self-assessment auditing at different points and have the audit reflect a date in time, versus a static stage of the process that moves with time. Both methods demonstrate that the agency is committed to maintaining anchor integrity. If the anchor drift feels strong, the agency can move towards refresher training or other follow-up methods that are meant to always keep therapists scoring to the anchors.
Show off your good work
When presenting data, you want to be able to articulate the procedural steps that your agency is taking to ensure that showing a positive trend line can be taken as a representation of actual client improvement. This can make all the difference between winning a contract or being overlooked despite your good work.
The views, information and opinions expressed herein are those of the author; they do not necessarily reflect those of the Council on Accreditation (COA). COA invites guest authors to contribute to the COA blog due to COA’s confidence in their knowledge on the subject matter and their expertise in their chosen field.

Tristan Keelan
Tristan Keelan is the Marketing Strategist at TenEleven Group. Tristan holds a BA in English from Elmira College and an MBA from St. Bonaventure University. He uses his experiences working in Government, Non-profit National Service, and Banking to bring business process and analytics driven insights to the behavioral health industry.
You can read blog posts from Tristan here.