It is comforting to believe we know ourselves, our community, the universe, and our place in it. How else could we get out of bed every morning? That said, we must admit that much of our knowledge is inherited or built on an imperfect (and sometimes dangerous) foundation of experience and a priori reasoning.
a priori (a pri-o-ri): relating to or denoting reasoning or knowledge that proceeds from theoretical deduction rather than from observation or experience.
This is what excites me about data. Can we call it salvation? When collected and analyzed properly, data removes our subjectivity and can offer a neutral, reliable view of the world – if only a miniscule slice of it. Data is the heart of COA’s performance and quality improvement standards, and drives human service providers to continually monitor performance and investigate flagging or abnormal measures. Being deep in the data revolution, we now have unprecedented access to data about the world outside of ourselves and our organizations – critical for human service providers who have a special mandate to know and respond to the communities they serve.
The following are some of my favorite sources of public data relevant to human service providers. May you find refuge and transformation within them!
Data USA
The U.S. government collects lots of data. Lots of it. And most of it is publicly available – though likely raw, disorganized, and inaccessible to anyone without the skills to process it. Data USA connects to these sources of government data and makes them consumable by all:
- Natural-language generation translates data into plain, simple statements; each page feels authored by a human hand.
- Beautiful visualizations show trends over time or communicate complex datasets.
There’s a whole lot here, too: data on universities, colleges, and education opportunities; demographic data on cities, counties, ZIP codes, and states; job and employment data; medical and healthcare data; and more. Enter in your city’s name and see what happens. But Data USA does something remarkable by using its data to create local, state, or national benchmarks. For example, its natural-language generation algorithm produces this statement about Polish speakers in Chicago, IL:
When compared to other census places, Chicago, IL has a relatively high number of residents that are native Polish speakers. In 2015, there were 49,464 native Polish speakers living in Chicago, IL, approximately 9.4 times more than would be expected based on the language’s frequency in the U.S. more broadly.
Honestly, there is so much here. I recommend setting aside 30 minutes to deeply explore this unbelievable service.
How can human service providers use this data?
Research the demographic profile of your city, state, or ZIP code to ensure your client engagement practices are culturally nuanced. Are your materials translated into all local languages? Is there an area of the city more likely occupied by your target clients and so more deserving of time and resources?
Compare your client demographic data to the demographics of your service area. Is it possible that one or more groups are missing out on your services?
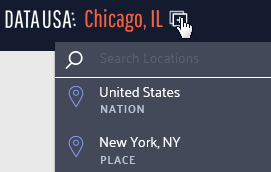
Use the compare function to analyze the differences between your service communities; to compare locations, click the icon shown below and select another location for comparison.
Individuals seeking services have often been fighting a long, lonely battle. Bolster your intake process by sharing relevant community data with service recipients to contextualize and destigmatize their experience. For example, a substance use treatment program could use the Excessive Drinking Prevalence measure found in the Risky/Harmful Behaviors section when serving individuals struggling with alcohol dependency.
Learn about basic measures of health and safety such as insurance coverage, medicare enrollment, and prevalent health conditions via the Health & Safety section of each location page.
Discover broader economic trends like this chloropleth on the poverty rate by county across the nation.
Nonprofit Finance Fund’s State of the Sector Survey
Since 2009, the Nonprofit Finance Fund (NFF) has run the State of the Sector survey to engage nonprofit organizations across the nation about their financial security and beyond: challenges facing their organization and their clients, opportunities they see in the next year, their use of program metrics and outcomes data, and more.
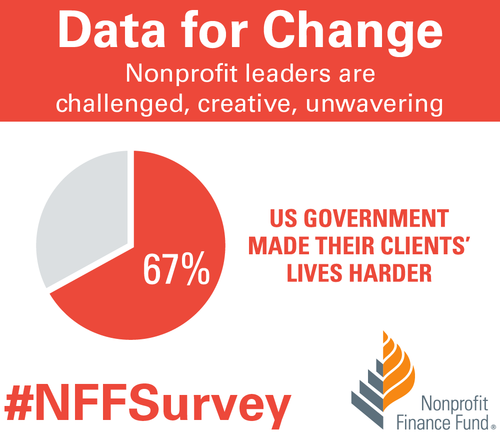
The 2018 survey results were affirming and surprising in equal measure. I’m not surprised that offering competitive pay is a top challenge reported by respondents, but that 67% felt the U.S. government made their clients’ lives harder? That’s shocking.
Want more? Tiffany Langston, Associate Director of Knowledge & Communications at NFF, provided a wonderful synopsis of the report, its function, and their findings in Data for Change: Nonprofit Leaders Raise Their Voices about the State of the Sector.
How can human service providers use this data?
Benchmarks are woefully scarce in the nonprofit/human service sector. Compare your organization’s performance to other nonprofits using many of the financial health measures found throughout the report. And, use the filters at the top to narrow the results to organizations like yours.
Start a conversation by reviewing the survey data with your team as either an element of your annual/strategic planning or simply as a team building exercise. Pause and reflect on each relevant question: what is the state of your organization and how could this impact your ability to deliver quality services? Do the findings reflect your neck of the woods? Why or why not?
Have an honest conversation about your organization’s theory of change, logic model, or outputs and outcomes measures. Are you, like 41% of respondents, operating without a theory of change or logic model? Do you, like 21% of respondents, not collect outcomes measures? How will this impact your ability to win grants in the future?
Leverage this data in conversations with policy makers and funders. Does your organization, like 60% of relevant respondents, receive late payments from your state? How does this inhibit or complicate your operations?
United States Census Bureau
The majority of the data output from the Census Bureau is aimed at researchers and other government entities and often not presented in an easily-consumable form. I recommend joining the Census Bureau’s mailing list for regular updates on gems like The Opportunity Atlas. This interactive map shows “the average outcomes (e.g., earnings) of children who grew up in each neighborhood in America, by demographic subgroup (race, gender, and parental income).”
Their Infographics & Visualizations page also has several interesting offers.
How can human service providers use this data?
Basic data on the communities served by human service organizations often reaffirm what front-line staff already know. But, being able to communicate these characteristics using hard data from respected institutions like the Census Bureau can bolster grant proposals, marketing collateral, and appeals to donors.
Forms 990 Data
How could we not talk about that shining ray of transparency, the Form 990? Let’s go beyond GuideStar and look at some fascinating services utilizing and transforming this data into information.
Citizen Audit
Citizen Audit makes the Form 990 look good. Traditional Form 990 data is accessible within a modern search interface and without learning what each schedule means (that’s 2 hours of my life I’ll never get back).
open990
Another beautiful interface for exploring Form 990 data. The layout is a bit simpler than Citizen Audit and shows a year by year comparison of all relevant data points by default.
ProPublica’s Nonprofit Explorer
Though less feature-rich than the services above, ProPublica’s Nonprofit Explorer provides quick and easy access to the text or raw XML versions of an organization’s Form 990 – great if you’re hunting for something in particular and want to execute a single page find across all data.
IRS Master Business File
For you pros out there, the IRS provides a download of all tax-exempt entities. These worksheets, divided into geographic regions (you can also download state-specific versions), contains the most recent Form 990 data on all tax-exempt entities.
How can human service providers use this data?
Benchmarks, benchmarks, benchmarks. Surely you are benchmarking your organization’s financial health against your past performance, but what about your peers? Dig up data on local organizations providing similar services and see how you compare.
Ask questions like:
- How are our financial ratios compared to our competitors?
- How does our CEO’s wage compare to other nonprofits like ours?
- We have 35 board members. Is that normal?
Find other organizations across the country providing similar services (for benchmarking or collaboration) using the NTEE code. The IRS categorizes all tax-exempt entities using this code; it’s a three character code where the first character, a letter, indicates the broad service area while 2 following digits reflect a narrower categorization of services. Find your NTEE code (most human service organizations have a P or F as the leading character), then find others with that same code and a similar revenue size. Use the resources above to dig into their 990 data.
Learn the ins and outs of your own organization – the 990 is typically comprehensive and is always a rewarding read. You might be surprised about what you discover!
Have you utilized any helpful data resources? If so, feel free to share them with us in the comments section!
These recommendations herein are those of the author; they do not constitute a formal endorsement by the Council on Accreditation.
Thank you to Tiffany Langston of the Nonprofit Finance Fund for this guest post!

History of the survey
In 2008, the economic downturn created an atmosphere of fear and uncertainty, not just for individuals, families, small businesses, and corporations, but it was also a very scary time for nonprofits and their clients. At Nonprofit Finance Fund (NFF), we wanted to find a way to tailor our financing and consulting services to be the most helpful to charitable organizations. How could we offer support, tools, and resources, so that nonprofits could navigate this tricky time? We decided to ask nonprofits how the changes in the economy affected their bottom line and the ability to serve their communities. The State of the Nonprofit Sector Survey was born.

Nonprofits are a linchpin in creating social good. Yet there is precious little collective, real-time data on how nonprofits are doing. Are they serving more clients or fewer? Do they have the resources they need to do their work? Are they opening new offices, or dangerously close to closing their doors?
We launched the first Survey in early 2009, with little fanfare and almost no promotion. We rolled up our sleeves, opened our rolodexes, and asked our networks to spend 15 minutes to tell us how they were feeling, what they were doing to combat the recession, and how NFF could help them deliver on their missions. We heard from 986 respondents, many of whom told us that they were feeling financially vulnerable, bracing for funding cuts across the board, preparing to end the year with a deficit, and developing a ‘worst-case scenario’ contingency plan. The recession brought into focus a serious, long-standing issue: the nonprofit sector is continually forced to do more with less, and the margin between stability and crisis is often precariously razor-thin.
But the thing that surprised us most was the numerous requests we got from media, researchers, policymakers, nonprofits, and funders, to do a deeper dive into the data. The results were published in The New York Times, CNN.com, and The Chronicle of Philanthropy. There was a thirst for real-time data, and at the time, no one else was doing this type of survey on a national scale.
Over the years, the questions adapted as the sector changed. It became a widely-watched barometer of US nonprofits’ programmatic, operational, and financial health. In 2010, we found that while the economy was recovering from the recession, nonprofits were not having the same success. By 2011, 87 percent of the 1,935 respondents said they still felt like the recession hadn’t ended. In 2012, we started asking about government grants and contracts, and if nonprofits were getting paid on time. The outlook finally started to improve by 2013, and we inquired about how organizations collected data and measured impact. And this year, we asked nonprofits about the diversity of their senior leadership and board members, and if their organizations proactively address racial inequity.
State of the nonprofit sector survey 2018
We are living in volatile times. As we prepared for the 2018 Survey, we were excited to get the pulse of the US nonprofit sector and better understand the challenges organizations now face. The 2018 State of the Nonprofit Sector Survey opened on January 16 and closed on February 28. We heard from 3,369 leaders across all 50 states and a wide range of sizes and missions. Respondents said they’re facing chronic challenges and real-time concerns, remain resilient and committed, but are worried about the vulnerable people they serve.
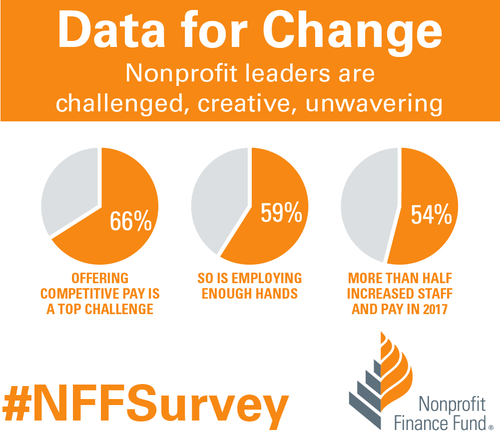
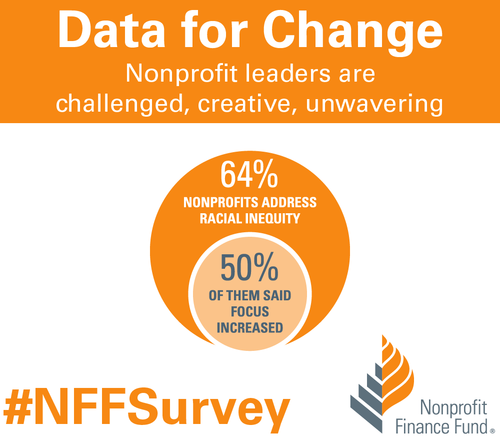
When asked about 2017, 79 percent of respondents saw an increase in demand for services, and 86 percent anticipate an increase in the coming year. Not only did 57 percent of nonprofits find it difficult to keep up with the rising demand last year, but that number swells to 65 percent for organizations serving low-income communities. Despite the challenges, nonprofits continue to invest in programs, staff, and strategies. We found that 52 percent of respondents said their organizations expanded services in 2017, and 63 percent plan to do so in 2018. We learned that 54 percent of responding nonprofits increased staff and 55 percent increased compensation in 2017. We found that 64 percent said they address racial inequity, and half of those said that focus grew in 2017. We also learned that 76 percent of responding nonprofits finished 2017 at break-even or better.
Affordable housing was the most-cited critical community need, followed by youth programs, mental and behavioral health services, and financial capability. We also asked nonprofit leaders how the federal government’s policies & positions influenced the communities they serve, and 67 percent said those practices make their clients’ lives more difficult. Additionally, 37 percent of respondents said their organizations plan to formally engage in policy/advocacy in 2018.

How to use the data
At NFF, our mission is to create a more just and vibrant society. One of the ways we work toward that is by sharing accessible insights, so that the sector has the necessary data to make informed decisions. You can explore the Survey results completely free of charge using our Analyzer. Compare your nonprofit to peer organizations across focus areas, sizes, and geographies. Use the findings to inform planning around strategy and budgeting. Cite data in your campaigns, white papers, testimonials, and grant proposals. Use the data as evidence to support open discussions with funders about the full costs of service delivery and meeting the needs of your communities.
We invite you to dig into the data. Use the filter or combination of filters that gives you the right slice of information for your presentation, board meeting, or application. You can even download images of the visualizations and drop them right into a slideshow or report. Please let us know how you’re using the findings to deliver on your mission. Email us, or share on social media using the hashtag #NFFSurvey. Thank you to everyone who took the State of the Nonprofit Sector Survey, entrusted NFF to raise your voices, and contributed to this critical social sector data set.
The views, information and opinions expressed herein are those of the author; they do not necessarily reflect those of the Council on Accreditation (COA). COA invites guest authors to contribute to the COA blog due to COA’s confidence in their knowledge on the subject matter and their expertise in their chosen field.

Tiffany Langston
Tiffany Langston is the Associate Director, Knowledge & Communications at Nonprofit Finance Fund. She has worked at the intersection of nonprofits and philanthropy for nearly a decade, including overseeing digital communication efforts for WaterAid America and Philanthropy New York, respectively. She is a food lover, writer, and her work has been nominated for a James Beard Foundation Journalism Award.