Thank you to Tiffany Langston of the Nonprofit Finance Fund for this guest post!

History of the survey
In 2008, the economic downturn created an atmosphere of fear and uncertainty, not just for individuals, families, small businesses, and corporations, but it was also a very scary time for nonprofits and their clients. At Nonprofit Finance Fund (NFF), we wanted to find a way to tailor our financing and consulting services to be the most helpful to charitable organizations. How could we offer support, tools, and resources, so that nonprofits could navigate this tricky time? We decided to ask nonprofits how the changes in the economy affected their bottom line and the ability to serve their communities. The State of the Nonprofit Sector Survey was born.

Nonprofits are a linchpin in creating social good. Yet there is precious little collective, real-time data on how nonprofits are doing. Are they serving more clients or fewer? Do they have the resources they need to do their work? Are they opening new offices, or dangerously close to closing their doors?
We launched the first Survey in early 2009, with little fanfare and almost no promotion. We rolled up our sleeves, opened our rolodexes, and asked our networks to spend 15 minutes to tell us how they were feeling, what they were doing to combat the recession, and how NFF could help them deliver on their missions. We heard from 986 respondents, many of whom told us that they were feeling financially vulnerable, bracing for funding cuts across the board, preparing to end the year with a deficit, and developing a ‘worst-case scenario’ contingency plan. The recession brought into focus a serious, long-standing issue: the nonprofit sector is continually forced to do more with less, and the margin between stability and crisis is often precariously razor-thin.
But the thing that surprised us most was the numerous requests we got from media, researchers, policymakers, nonprofits, and funders, to do a deeper dive into the data. The results were published in The New York Times, CNN.com, and The Chronicle of Philanthropy. There was a thirst for real-time data, and at the time, no one else was doing this type of survey on a national scale.
Over the years, the questions adapted as the sector changed. It became a widely-watched barometer of US nonprofits’ programmatic, operational, and financial health. In 2010, we found that while the economy was recovering from the recession, nonprofits were not having the same success. By 2011, 87 percent of the 1,935 respondents said they still felt like the recession hadn’t ended. In 2012, we started asking about government grants and contracts, and if nonprofits were getting paid on time. The outlook finally started to improve by 2013, and we inquired about how organizations collected data and measured impact. And this year, we asked nonprofits about the diversity of their senior leadership and board members, and if their organizations proactively address racial inequity.
State of the nonprofit sector survey 2018
We are living in volatile times. As we prepared for the 2018 Survey, we were excited to get the pulse of the US nonprofit sector and better understand the challenges organizations now face. The 2018 State of the Nonprofit Sector Survey opened on January 16 and closed on February 28. We heard from 3,369 leaders across all 50 states and a wide range of sizes and missions. Respondents said they’re facing chronic challenges and real-time concerns, remain resilient and committed, but are worried about the vulnerable people they serve.
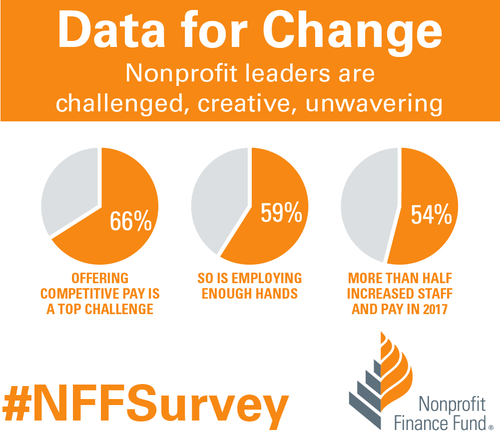
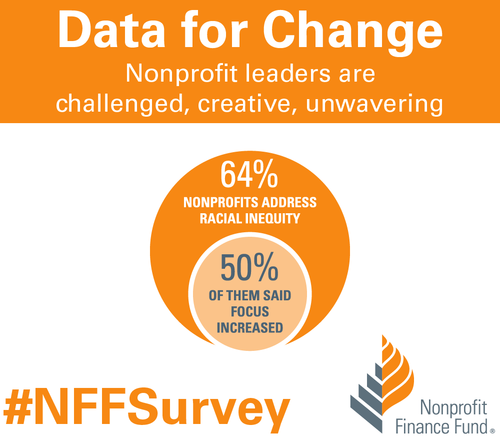
When asked about 2017, 79 percent of respondents saw an increase in demand for services, and 86 percent anticipate an increase in the coming year. Not only did 57 percent of nonprofits find it difficult to keep up with the rising demand last year, but that number swells to 65 percent for organizations serving low-income communities. Despite the challenges, nonprofits continue to invest in programs, staff, and strategies. We found that 52 percent of respondents said their organizations expanded services in 2017, and 63 percent plan to do so in 2018. We learned that 54 percent of responding nonprofits increased staff and 55 percent increased compensation in 2017. We found that 64 percent said they address racial inequity, and half of those said that focus grew in 2017. We also learned that 76 percent of responding nonprofits finished 2017 at break-even or better.
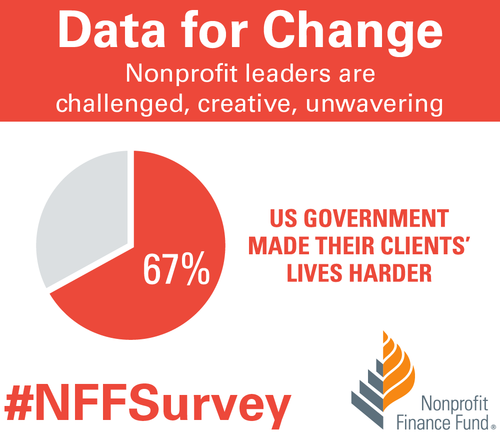
Affordable housing was the most-cited critical community need, followed by youth programs, mental and behavioral health services, and financial capability. We also asked nonprofit leaders how the federal government’s policies & positions influenced the communities they serve, and 67 percent said those practices make their clients’ lives more difficult. Additionally, 37 percent of respondents said their organizations plan to formally engage in policy/advocacy in 2018.

How to use the data
At NFF, our mission is to create a more just and vibrant society. One of the ways we work toward that is by sharing accessible insights, so that the sector has the necessary data to make informed decisions. You can explore the Survey results completely free of charge using our Analyzer. Compare your nonprofit to peer organizations across focus areas, sizes, and geographies. Use the findings to inform planning around strategy and budgeting. Cite data in your campaigns, white papers, testimonials, and grant proposals. Use the data as evidence to support open discussions with funders about the full costs of service delivery and meeting the needs of your communities.
We invite you to dig into the data. Use the filter or combination of filters that gives you the right slice of information for your presentation, board meeting, or application. You can even download images of the visualizations and drop them right into a slideshow or report. Please let us know how you’re using the findings to deliver on your mission. Email us, or share on social media using the hashtag #NFFSurvey. Thank you to everyone who took the State of the Nonprofit Sector Survey, entrusted NFF to raise your voices, and contributed to this critical social sector data set.
The views, information and opinions expressed herein are those of the author; they do not necessarily reflect those of the Council on Accreditation (COA). COA invites guest authors to contribute to the COA blog due to COA’s confidence in their knowledge on the subject matter and their expertise in their chosen field.

Tiffany Langston
Tiffany Langston is the Associate Director, Knowledge & Communications at Nonprofit Finance Fund. She has worked at the intersection of nonprofits and philanthropy for nearly a decade, including overseeing digital communication efforts for WaterAid America and Philanthropy New York, respectively. She is a food lover, writer, and her work has been nominated for a James Beard Foundation Journalism Award.